Discover how to improve website performance with our guide. Learn actionable frontend and backend fixes to boost speed and pass Core Web Vitals.
Jan 11, 2026
Improving your website's performance isn't just one single fix. It's a combination of smart optimizations across your frontend, backend, and delivery pipeline. The name of the game is simple: reduce the amount of data you send, minimize the number of server requests, and make sure every resource loads as efficiently as possible. Get that right, and you’ll create a fast, responsive experience that users love.
Why Website Performance Is a Core Business Metric
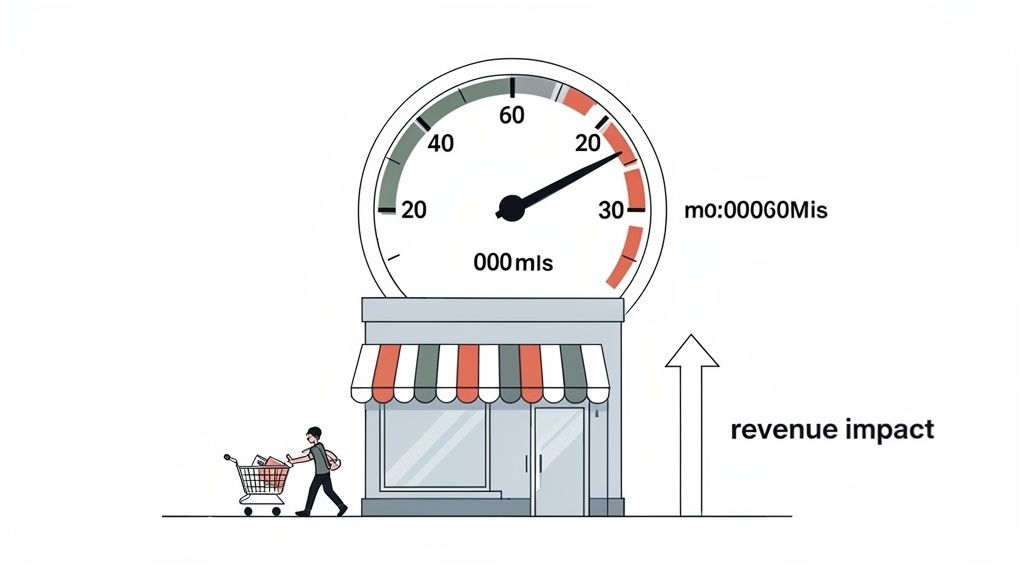
Let's stop thinking about website speed as a technical task for the IT department. It’s a crucial business metric that hits your bottom line, hard. Every millisecond of delay can mean lost revenue, eroding user trust, and a brand that looks unprofessional. A slow website is actively working against your business goals.
Think about it. A customer finds the exact product they want on your e-commerce site. They click "add to cart," but the checkout page takes a painful five seconds to appear. In that tiny window of friction, doubt sets in. They leave. This exact scenario plays out millions of times a day online.
The Widening Gap in User Expectations
What users expect and what they actually get are often worlds apart. Today, 50% of users expect a site to load in under 2 seconds, but the average mobile site lumbers along, taking a full 8.6 seconds.
This is a massive problem, especially on mobile, where 53% of visitors will abandon a page that takes longer than 3 seconds to load. This gap isn't a problem—it's a huge opportunity for any business that decides to get serious about speed.
When you treat performance as a business strategy, you realize every team has a stake in it.
From Tech Problem to Business Strategy
Making your site faster isn't just about code; it's about the entire business.
For Marketing: Faster landing pages mean better Quality Scores in your ad campaigns and, more importantly, higher conversion rates.
For Sales: A quick-loading demo or trial signup page removes friction right when a lead is hottest.
For Leadership: A snappy, responsive site signals quality and professionalism. It’s a direct reflection of the brand itself.
A fast website is no longer a competitive advantage; it's a fundamental requirement. Users now equate speed with trust and reliability. If your site is slow, they assume your service or product will be too.
Ultimately, investing in performance is investing in your customer experience. It shows you value their time and are committed to getting them to what they want without frustrating delays. If you're focusing on speed, you'll probably also want to learn how to improve website conversion rates, since the two go hand-in-hand.
How to Accurately Measure Your Website Speed
You can't fix what you don't measure. Before you even think about optimizing a single line of code, you need a clear, honest picture of your website's current performance. Simply timing how fast a page loads on your own high-speed Wi-Fi isn't going to cut it—that's a fantasy scenario that has little to do with what your actual users experience on spotty connections and older devices.
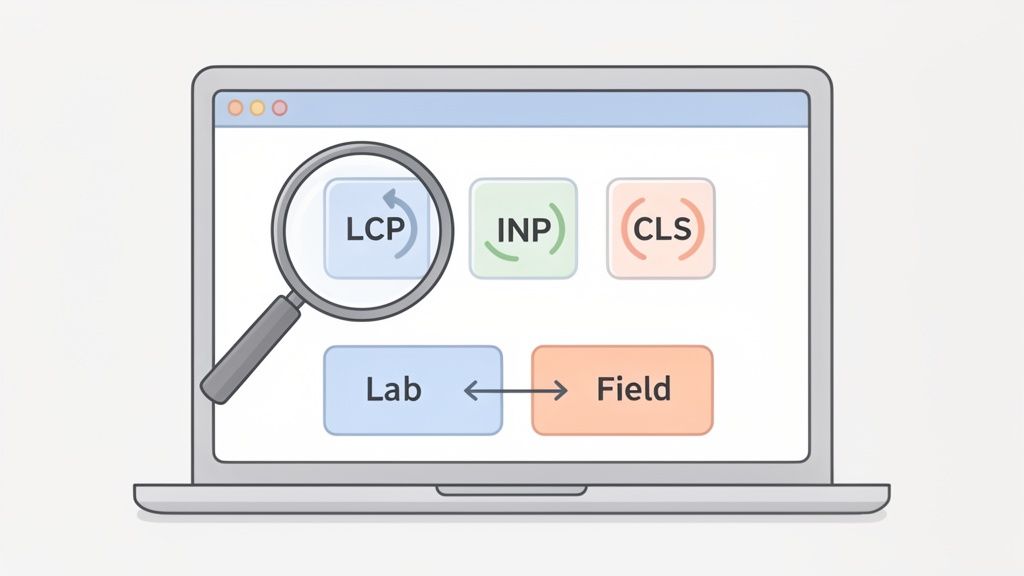
To really get to the bottom of performance issues, you need to look at two types of data: lab data and field data. Think of it this way: lab data is like a controlled test in a pristine lab, while field data is what happens out in the messy, unpredictable real world.
Start with Lab Data Using Lighthouse
Your first move should be to run a Google Lighthouse audit. This is your baseline. It's built right into Chrome DevTools and gives you a "lab" test by simulating how your page loads on a mid-range phone over a less-than-perfect network connection. This consistency is key for before-and-after testing.
Lighthouse spits out a detailed report with scores for Performance, Accessibility, Best Practices, and SEO. We're obviously focused on that performance score. It will immediately point out the low-hanging fruit—things like massive images, scripts that block the page from loading, or a sluggish server. A deep dive into this initial report is the bedrock of any solid performance strategy, and you can learn more by checking out our complete website performance audit guide.
Understand the Core Web Vitals
Within that Lighthouse report, you’ll see Google puts a heavy emphasis on three metrics called the Core Web Vitals. These aren't just arbitrary numbers; they’re designed to measure what the user actually feels when a page is loading.
Largest Contentful Paint (LCP): This is all about loading performance. It marks the moment the main event—the big hero image or the primary headline—appears on screen. A good LCP is 2.5 seconds or less.
Interaction to Next Paint (INP): This one’s about interactivity. It measures how quickly the page reacts when someone clicks a button, taps a link, or types in a form. You're aiming for under 200 milliseconds.
Cumulative Layout Shift (CLS): This tracks visual stability. You know when an ad suddenly loads and pushes all the content down just as you're about to click something? That’s layout shift. A good CLS score is 0.1 or less.
These metrics directly translate to user frustration or delight. A slow LCP means people are just staring at a blank screen, wondering if something is broken. A high INP makes your site feel clunky and unresponsive.
Focusing on Core Web Vitals is one of the most effective ways to improve user experience because they measure what people actually feel when they use your website—speed, responsiveness, and stability.
Here's a quick breakdown of why these metrics are so critical.
Key Performance Metrics and Their Business Impact
This table connects the dots between the technical jargon and what it means for your bottom line.
Metric (Core Web Vital) | What It Measures | Good Target | Business Impact of a Poor Score |
|---|---|---|---|
Largest Contentful Paint (LCP) | Perceived loading speed; when the main content is visible. | ≤ 2.5 seconds | High bounce rates; users leave before the page even loads. |
Interaction to Next Paint (INP) | Responsiveness to user actions (clicks, taps, typing). | ≤ 200 ms | Frustration, cart abandonment, perception that the site is broken. |
Cumulative Layout Shift (CLS) | Visual stability; how much elements move around during load. | ≤ 0.1 | Accidental clicks, user annoyance, reduced trust in the site. |
When these numbers are off, your conversion rates, user satisfaction, and even your SEO rankings take a direct hit.
The Importance of Field Data and RUM
Lighthouse is a phenomenal diagnostic tool, but it's not the whole story. To see what’s really happening, you need "field data," which you get from Real User Monitoring (RUM). This is data collected from your actual visitors in the wild.
Tools like the Chrome User Experience (CrUX) Report (which is what Google uses for its search rankings), Google Analytics, and Vercel Analytics gather this anonymous performance data. It's incredibly valuable because it shows you how your site performs across thousands of different devices, network conditions, and locations. You might find out your LCP is fantastic for users in New York but terrible for those in London, immediately pointing to a need for a better Content Delivery Network (CDN).
The goalposts have moved, too. Today, a Time to First Byte should be under 0.8 seconds and LCP under 2.5 seconds. Poor performance on interactivity (INP) has been shown to directly correlate with 40% lower conversion rates, making speed a critical part of protecting your revenue.
By combining the controlled lab data from Lighthouse with the real-world field data from RUM, you get a complete, actionable view of your website's performance. It’s a powerful one-two punch that lets you find problems, test your fixes, and then confirm they’re actually making a difference for real people.
Frontend Fixes That Deliver The Biggest Wins
After you’ve got your baseline numbers, it's time to dig in and make the changes your users will actually feel. Most of the sluggishness people experience happens right in their browser—what we call the "frontend." This is your biggest opportunity to make an immediate, noticeable impact on your site's speed.
We'll start with the heavy hitters: getting your images in check and taming unruly scripts and stylesheets. Nailing these two areas can fundamentally change how fast your site feels to a real person.
Tame Your Images First
Let's be blunt: images are almost always the heaviest thing on a web page. This makes them public enemy number one for slow load times. The good news? Fixing them is usually straightforward and gives you a massive return on your effort.
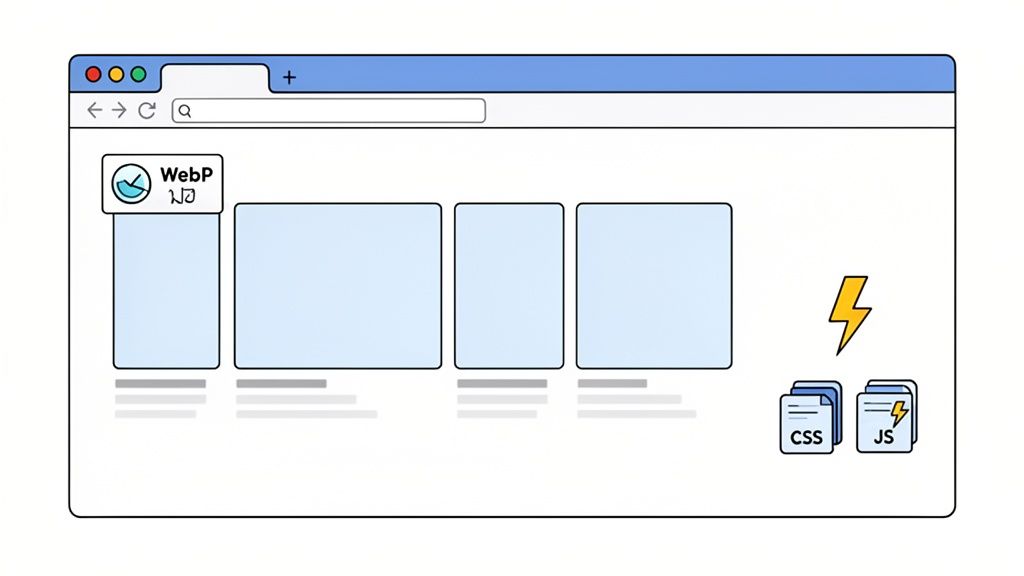
First up, switch to modern image formats. Formats like WebP and AVIF are a game-changer, offering way better compression than old-school JPEGs and PNGs. You get similar (or better) quality in a much smaller file. I’ve seen a 1MB hero image shrink down to just 300KB as a WebP—that's a 70% reduction with zero visible loss in quality.
Next, you absolutely must use responsive images. By using the <picture> element or the srcset attribute in your <img> tags, you let the browser pick the right-sized image for the user's screen. This is crucial. It stops a mobile user on a spotty 4G connection from wasting data downloading a gigantic image designed for a 4K desktop monitor.
And finally, a simple but powerful trick: lazy load any images that aren't immediately visible. Adding the loading="lazy" attribute to an image tag is all it takes. This tells the browser, "Don't bother downloading this until the user scrolls it into view." It's a tiny change that dramatically cuts down the number of initial requests.
Demystify Render-Blocking Resources
Ever stare at a blank white screen waiting for a site to appear? You were waiting on "render-blocking resources." These are files, typically CSS or JavaScript, that the browser must download and process before it can show you anything. The more of them you have, the longer that dreaded blank screen lasts.
Your goal is to load only the absolute minimum CSS and JavaScript needed to render what the user sees first. Everything else can wait.
This all comes down to understanding the critical rendering path. By default, any <script> tag you place in the <head> of your HTML is going to block rendering.
To fix this, get familiar with the defer attribute: <script src="your-script.js" defer></script>
Using defer is a simple instruction to the browser: download this script in the background without stopping, and only run it after the rest of the page is ready. For things like analytics trackers or chat widgets, this is a must. While async is another option, defer is generally the safer bet because it ensures your scripts still execute in the order you listed them.
Minification and Code Splitting
Once you've pushed non-critical scripts out of the way, it's time to shrink the files that are left.
Minification is the process of stripping out all the junk from your code—whitespace, comments, line breaks—without affecting how it works. Your build tools can do this automatically, often slashing file sizes by 30-50%. A smaller file is a faster file. Simple as that.
Code splitting is a more advanced technique, but it's incredibly powerful. Instead of shipping one giant JavaScript file with code for your entire site, you break it into smaller, logical chunks. The browser then only loads the specific code needed for the page the user is actually on.
For instance, someone on your homepage has no need for the JavaScript that runs your complicated checkout flow. By splitting that checkout code into its own file, you make the homepage load that much faster. Modern frameworks like React and Vue have made this much easier to implement than it used to be. For a closer look at how this fits into the big picture, our post on the website development process breaks down the entire lifecycle.
If you're looking to dive even deeper, especially with specific frameworks, you can find great tools to optimize performance in React. By putting these frontend fixes together, you'll build a website that feels snappy and responsive for every single visitor.
Backend Optimizations For A Rock-Solid Foundation
Even the most lightweight frontend will feel sluggish if it’s waiting on a slow server. While users see the frontend fixes, they feel the backend optimizations every time they get a snappy, reliable response. This is all about building a rock-solid foundation for your entire site.
A slow backend is like a restaurant with a brilliant host but a chaotic kitchen. It doesn't matter how great the welcome is if the food takes an hour to arrive. Let’s go fix the kitchen.
Shrink The Globe With a Content Delivery Network
The internet is a physical thing. Data literally has to travel through wires and across oceans, and that takes time. This delay, known as latency, is a major performance killer, especially if you have a global audience.
A Content Delivery Network (CDN) is the single most effective weapon against latency.
A CDN is just a network of servers spread across the globe. It takes a copy of your site's static assets—images, CSS, JavaScript—and caches them in locations much closer to your actual users. When someone from Tokyo visits your site hosted in Virginia, they don't have to wait for the data to cross the Pacific. They get it from a server right there in Japan.
This one change can slash latency and make a world of difference for your international visitors. Most modern hosting platforms have CDNs built-in, so setting it up is often just a flip of a switch.
Master The Art of Caching
Caching is a simple principle: don't do work you don't have to. It’s about storing the results of an expensive operation so you can serve it up instantly the next time it's requested. Think of it as keeping a pre-made meal in the fridge instead of cooking from scratch every single time.
You can—and should—implement several layers of caching:
Browser Caching: This tells a user's browser to store static files locally on their device. When they click to a second page, their browser pulls the logo, fonts, and stylesheets from its own memory instead of re-downloading them. This makes navigating your site feel almost instant.
CDN Caching: The CDN itself can cache not just static assets but entire page responses from your server. For popular pages, the CDN can serve the full HTML to users without even having to ask your server for it. This takes a huge load off your infrastructure.
Server-Side Caching: This happens on your own server. For example, if a blog post requires several database queries to build, you can cache the final HTML output. The first visitor triggers the database work, but the next thousand visitors get the pre-built, cached version in a flash.
Caching isn't just a performance trick; it's a core architectural strategy. A well-designed caching strategy reduces server load, cuts costs, and delivers a faster experience to your users.
Getting these layers right transforms your server from a short-order cook frantically making every dish to order into an efficient kitchen serving up popular dishes in seconds.
Improve Your Server Response Time
The very first thing that happens when a user requests your page is a wait. They're waiting for your server to think, process the request, and send back the first byte of data. We measure this with Time to First Byte (TTFB), and a high TTFB is a dead giveaway that you have a backend bottleneck.
A good TTFB is generally under 800 milliseconds. Anything over that, and users start to feel that delay before anything even begins to load on their screen.
So, how do you fix a slow TTFB?
Choose Better Hosting: Shared hosting might be cheap, but you're sharing resources with hundreds of other sites. If one of them gets a traffic spike, your site pays the price. Moving to a dedicated server or a modern cloud platform like Vercel or Netlify gives you the resources you actually need.
Optimize Database Queries: So many sites are slowed down by clunky database lookups. A single complex query to fetch products or user data can add whole seconds to your response time. Properly indexing your database tables and simplifying queries can make a massive difference.
Upgrade Your Stack: Older versions of languages (like PHP or Node.js) or databases are often much slower than their modern counterparts. Simply upgrading can provide a significant performance boost out of the box. For those on the Laravel framework, dedicated insights on optimizing web performance with Laravel development can provide a huge advantage.
By combining a global CDN, a smart caching strategy, and a finely tuned server, you create a backend that can handle anything you throw at it, ensuring your site is fast and responsive for every single user.
You’ve done the hard work of optimizing your site, and it’s finally fast. Great. Now, how do you keep it that way?
This is where the real work begins. Getting a site into shape is one thing; preventing it from slowly degrading over time is another challenge entirely. Every new feature, marketing script, or high-res image is a potential speed bump.
Website performance isn't a project you complete and check off a list. It’s a cultural shift. It’s about getting everyone on the team—from product managers and designers to the engineers writing the code—to see speed as a core feature, not just a technical chore. When performance becomes a shared responsibility, it stops being a problem and starts becoming a powerful competitive advantage.
Establish a Performance Budget
The single best tool I've found for embedding this mindset is a performance budget. No, this isn't about money. It's a set of hard limits for your web pages that everyone agrees on before development starts.
Think of it like a weight limit for your carry-on luggage. You know you can’t go over 22 pounds, so you pack strategically. You make trade-offs. A performance budget forces the same discipline for your website, preventing it from getting bloated with assets you don't truly need.
A simple budget might look like this:
Total Page Size: Under 1.5 MB
Image Weight: Keep all images under a combined 500 KB
JavaScript Size: No more than 400 KB (uncompressed)
Number of Requests: Keep it below 75
Lighthouse Score: Must stay above 90 on performance
A performance budget transforms a vague goal like "make the site faster" into a concrete, measurable rule. It empowers your team to ask the right questions upfront: "Can we truly afford the performance cost of this new JavaScript library?"
This simple framework helps you stop cleaning up messes and start preventing them in the first place.
Here’s a look at how a well-tuned backend, complete with a CDN, helps you stay within those budget goals by slashing the time it takes for data to travel from your server to the user.
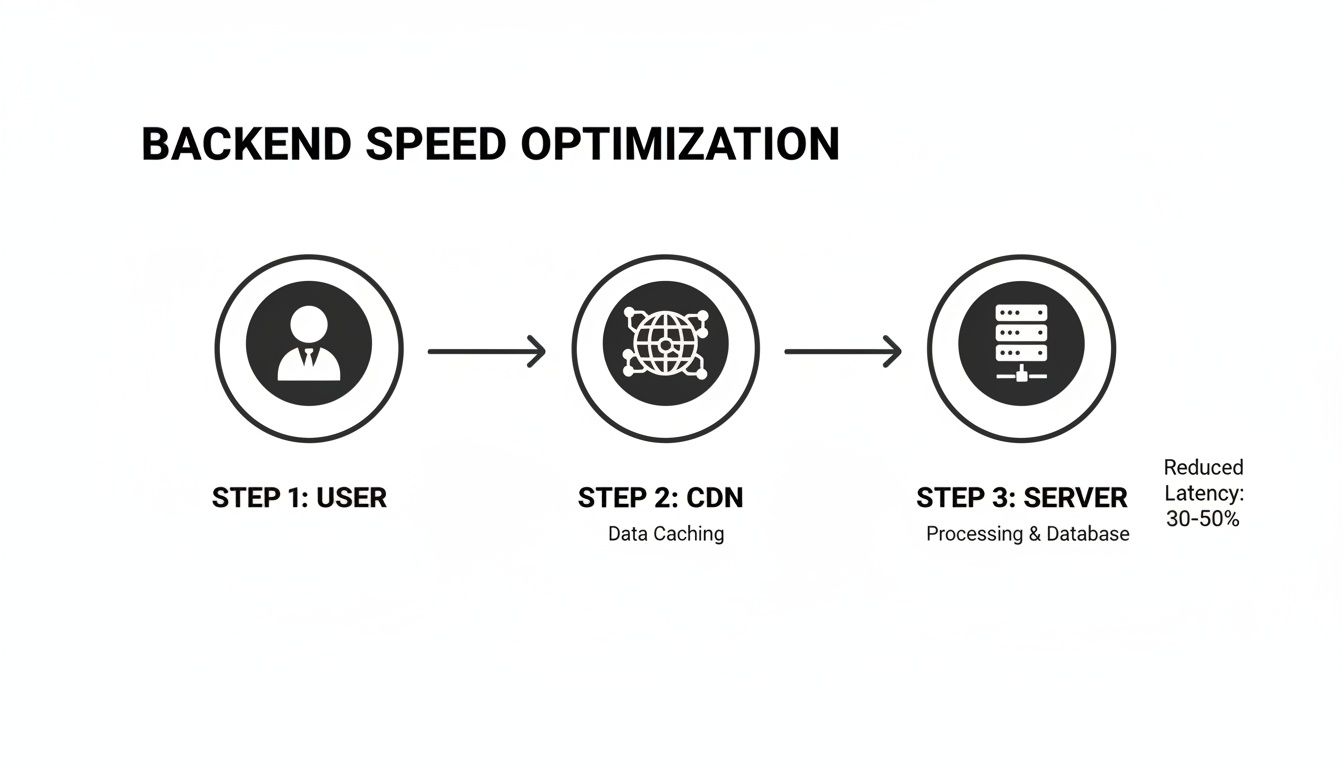
By caching content closer to your visitors, a CDN essentially acts as a gatekeeper. It serves assets directly, shielding your main server from unnecessary traffic and delivering content much, much faster.
Automate Performance Checks in Your Workflow
A budget is useless if you don't enforce it. The most reliable way to do that is to automate it. By baking performance checks directly into your development pipeline, you create a safety net that catches problems before they ever reach your customers.
Tools like Lighthouse CI can be hooked into your continuous integration system (like GitHub Actions or Jenkins). Every time a developer submits new code, an audit runs automatically. If that new code adds a massive image or a bloated script that pushes the page over budget, the build fails.
The flow is straightforward:
A developer commits a code change.
The CI server kicks off an automated build.
Lighthouse CI runs against the changed pages, checking them against your budget.
If the pages pass, the build is approved. If not, it fails, and the developer gets an immediate notification.
This kind of instant feedback is incredibly powerful. It stops performance regressions before they happen and, over time, naturally trains developers to be more mindful of the performance impact of their work.
Prioritize Fixes Based on Business Impact
Even with a budget and automation, you'll still find issues that need attention. The trick is to avoid getting bogged down in an endless to-do list. You have to prioritize. After all, a slow "About Us" page is an annoyance, but a checkout flow that hangs for five seconds is costing you money.
I recommend using a simple prioritization matrix. For every issue you find, ask two things:
Effort to Fix: Is it low, medium, or high?
Business Impact: Is the benefit low, medium, or high?
Start with the high-impact, low-effort tasks. Those are your quick wins. Optimizing a hero image that appears on all your main landing pages fits perfectly here. On the other hand, a complete backend overhaul is a high-effort project that requires serious planning.
This pragmatic approach ensures your team is always focused on the fixes that deliver the most tangible value to both your users and your bottom line.
Answering Your Top Website Performance Questions
When you start digging into website performance, the theory is one thing, but making it work for your site is another. You're going to have questions. Everyone does.
Let's walk through some of the most common ones I hear from teams who are just getting started on making their sites faster.
Which Performance Metric Should I Actually Focus On First?
Pop open a Lighthouse report for the first time, and it's easy to feel overwhelmed by all the numbers. My advice? Keep it simple and start with Largest Contentful Paint (LCP).
LCP tells you when the most important piece of content on the page has loaded. Nailing this metric gives users the biggest "wow, this feels fast" impression right away. Aim to get your LCP under 2.5 seconds—that's a solid, achievable first goal.
Once you've got LCP in a good spot, turn your attention to Interaction to Next Paint (INP). This one is all about responsiveness. It measures how quickly your site reacts to clicks, taps, and key presses, which is critical for making your site feel alive and not clunky.
How Much Does a CDN Really Help?
It's a game-changer. A Content Delivery Network (CDN) isn't just a nice-to-have; for any site with users spread across different countries, it's non-negotiable.
Think about it: if your server is in New York, a visitor from Australia has to wait for every single file to travel halfway around the globe. A CDN solves this by placing copies of your assets (images, CSS, JavaScript) on servers all over the world. That user in Australia now grabs those files from a server in Sydney, and the difference in speed is massive.
It's not the complicated setup it used to be, either. Modern platforms like Cloudflare, Vercel, or Netlify have made this incredibly easy. It's often just a quick DNS change that can be done in under an hour, giving you an immediate speed boost for your international audience.
Can I Keep My High-Quality Images and Still Have a Fast Site?
Absolutely. This is probably the most common fear I see, but you don't have to choose between beautiful visuals and a fast website. You just have to be smart about how you handle them.
For every image, run through this simple checklist:
Compress first, always. Use a tool like Squoosh to shrink the file size. You can usually shave off a lot without any noticeable drop in quality.
Use modern formats. Serve images in WebP or AVIF. These formats are far more efficient than old-school JPEGs and can often cut file sizes by another 30-50%.
Lazy load anything below the fold. For images that aren't visible when the page first loads, add the
loading="lazy"attribute. This tells the browser to wait to download them until the user actually scrolls down.
And one last thing: always use responsive images with the srcset attribute. This stops you from forcing a tiny mobile device to download a massive, desktop-sized hero image over a shaky connection.
Why Is My Lighthouse Score Good, But My Users Still Complain?
Ah, the classic "lab vs. field" data problem. This trips up so many teams.
Lighthouse runs its tests in a controlled "lab" environment. It's like testing a car on a perfect, empty track—it's great for consistent measurements and catching issues before you deploy.
But your users are out in the "field." They're on countless different devices, browsers, and unpredictable network conditions, from spotty coffee shop Wi-Fi to a weak 4G signal. Their real-world experience is what truly counts.
This is exactly why Real User Monitoring (RUM) is so important. Tools like the speed reports in Google Analytics 4 or Vercel Analytics gather performance data from actual user sessions. RUM data shows you what's really happening, revealing the bottlenecks that Lighthouse might miss and giving you a true picture of how your site performs for real people.
Ready to turn these insights into action? Shalev Agency is a design and development partner that helps teams build high-converting websites that are as fast as they are beautiful. Let's talk about how we can improve your website performance.