
Learn how to improve website conversion rates with actionable strategies for diagnostics, UX fixes, prioritization, and A/B testing that drive real growth.
Jan 11, 2026
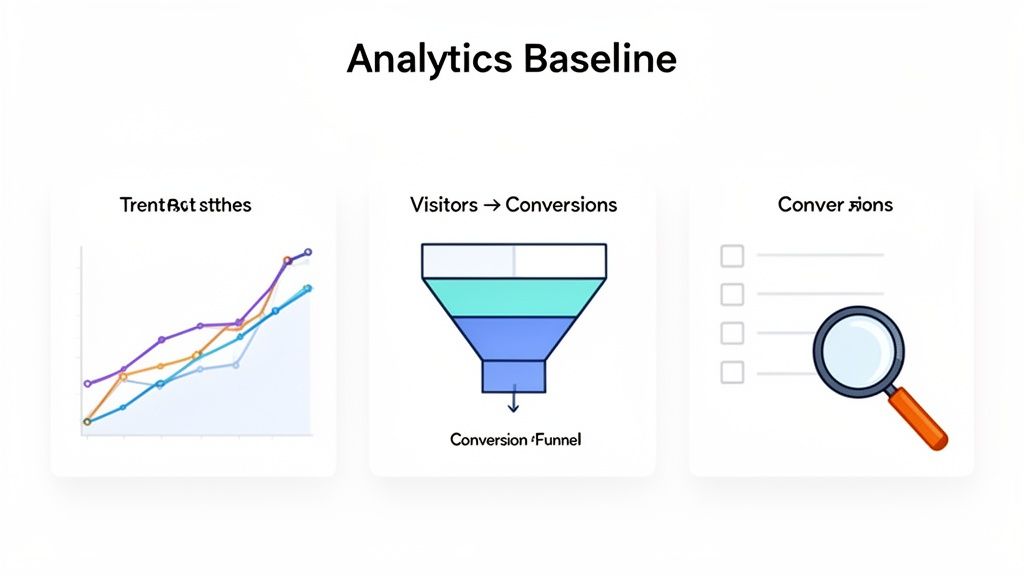
Before you can boost your conversion rates, you need a clear-eyed look at where you stand right now. This is all about setting a data-driven baseline—your starting line. We'll diagnose what's working and what's not by digging into your analytics, finding the leaks in your funnel, and seeing how you stack up against the competition.
1. Establish Your Conversion Baseline
It's tempting to jump straight into A/B testing headlines or tweaking button colors. But without knowing your starting numbers, you're just guessing. You might see some movement, but you won't know if you're actually heading in the right direction. Establishing a clear baseline is the non-negotiable first step.
Think of it as creating a data-rich snapshot of your site's current health. It's the difference between saying "our sign-ups feel a little low" and knowing "our pricing page converts at 1.5%, which is 50% below our target." That kind of clarity is what lets you set real goals and measure the true impact of your work.
Define Your Key Conversion Metrics
First things first: what actions actually move the needle for your business? Forget vanity metrics like page views. We're looking for the numbers that directly tie to growth and revenue.
Depending on your business model, these might be:
For SaaS: Demo requests, free trial sign-ups, or plan upgrades.
For eCommerce: Completed purchases, items added to cart, or newsletter subscriptions.
For B2B Services: Contact form submissions, whitepaper downloads, or consultation bookings.
Once you've nailed these down, get them set up as conversion goals in your analytics tool, like Google Analytics 4 (GA4). Accurate tracking is the foundation for everything that comes next. If you want to make this data easy to understand at a glance, our guide on dashboard design best practices can help.
Benchmark Against Industry Averages
Okay, you have your numbers. Now, how do they look? Context is everything. To give you a rough idea, we've pulled some data to see how different traffic channels typically perform.
Conversion Rate Benchmarks by Channel
A quick look at average conversion rates across different traffic sources to help you benchmark your performance.
Traffic Channel | Average Conversion Rate | Key Takeaway |
|---|---|---|
Paid Search | 3.2% | High-intent users actively searching for a solution. Often the highest converting channel. |
Organic Search | 2.8% | Strong intent, but users might be in the research phase. Content quality is crucial. |
Direct Traffic | 2.5% | Users already know your brand. A good indicator of brand strength and loyalty. |
Social Media | 1.1% | Lower intent, as users are often browsing casually. Top-of-funnel engagement is key. |
Display Ads | 0.6% | Primarily for awareness, not direct conversions. Expect very low rates here. |
These benchmarks help you see if you're in the right ballpark. For example, if your eCommerce store is converting at 1% while the industry average hovers around 2.5%, you know there's a huge opportunity waiting. This comparison helps set ambitious but realistic goals for your optimization efforts.
Don't get hung up on hitting a specific industry number. Your most important benchmark is always your own past performance. The real goal is continuous improvement from your baseline.
This initial audit gives you the "before" picture. It makes every future "after" that much more meaningful and is exactly how you'll prove the ROI of your CRO work.
Getting to the "Why" Behind Low Conversions
Analytics are great for telling you what's happening on your site. For instance, you might see a huge drop-off on your pricing page. That's the what. But to actually fix the problem and boost your conversion rate, you need to dig deeper and figure out why it's happening. This is where you trade your analyst hat for a detective's magnifying glass.
You have to move beyond the clean numbers on a dashboard and start observing real human behavior. It’s the combination of hard data and real-world user insights that leads to breakthroughs. Knowing you have a leak is one thing; finding the exact crack in the pipe is another.
Seeing Your Site Through Your Users' Eyes with Heatmaps
One of the most revealing tools in the CRO toolkit is the heatmap. Platforms like Hotjar or Crazy Egg create a visual map of where people are actually clicking, how far down the page they scroll, and where their mouse hovers.
This isn't just more data—it’s a direct window into your user's mind. You can see, clear as day, which buttons are being ignored, what headline actually grabs their attention, and the exact spot where they lose interest and stop scrolling—often right before your most important call-to-action (CTA).
Here’s a classic scenario I see all the time: analytics show that a "Request a Demo" button has a terrible click-through rate. But a heatmap reveals the real story. Users are furiously clicking on a nearby image that looks like a button but isn't actually clickable. That’s a rage click, and it’s a bright red flag for user frustration that you’d never spot in your analytics alone.
Heatmaps turn anonymous data into a visual story. They show you the 'why' behind a low click-through rate, pointing out confusing design choices or missed opportunities that are silently killing your conversions.
This kind of visual proof is incredibly powerful when you need to make a case for a design change. It shifts the conversation from, "I have a hunch we should change this," to, "Look, 75% of our visitors are ignoring our main CTA and are instead clicking this dead icon. We have to fix this."

The image above is a perfect example. The bright red spots on the main navigation and CTA show they’re getting clicks, which is great. But look at the much cooler colors on the secondary links—that tells you people are likely overlooking or misunderstanding them.
Just Ask: Gathering Feedback Directly from Users
While heatmaps show you what people do, sometimes the quickest path to an answer is to simply ask them what they think. Direct feedback tools are the bridge between observing a behavior and truly understanding the motivation behind it.
You don't need to overthink this. Forget about launching a massive, 20-question survey. Small, timely, and contextual feedback prompts are far more effective.
Here are a few dead-simple ways to start gathering insights right away:
On-Page Polls: On a page with a high exit rate, pop up a small, unintrusive poll. For a pricing page, you could ask, "Is our pricing clear? Yes/No." If someone clicks "No," follow up with a simple text box: "What's confusing?"
Exit-Intent Surveys: The moment a user's cursor darts for the back button, trigger a friendly pop-up. Something low-pressure like, "Hey, before you go, could you tell us what you were looking for?" can uncover missing information that’s a deal-breaker for visitors.
Post-Conversion Questions: For the people who actually convert, use the "thank you" page to ask one powerful question: "What was the one thing that almost stopped you from signing up today?" The answers you get will highlight the exact friction points you need to smooth out for everyone else.
These methods give you the actual words your customers use to describe their problems. That language is pure gold. You can use it to not only fix UX issues but also to sharpen your marketing copy, headlines, and value propositions. You stop guessing what resonates and start using the exact phrases your audience connects with.
How to Prioritize Fixes for Maximum Impact
You’ve done the hard work of digging through the data, and now you’re staring at a monster list of potential fixes. Broken links, confusing headlines, slow-loading images, a dozen other conversion killers... it’s easy to feel overwhelmed.
So, where do you start?
The secret isn’t trying to tackle everything at once. It’s about being smart and strategic. A disciplined approach to prioritization is what separates the teams that get real results from those that just spin their wheels. It turns a chaotic to-do list into a focused, high-impact action plan.
Without a solid framework, teams often drift toward fixing whatever is easiest or whichever problem is getting the most complaints. That’s a recipe for mediocrity. Let's look at a couple of simple but powerful models to help you make data-informed decisions instead of just going with your gut.
The Impact Versus Effort Matrix
One of the simplest and most effective ways to get your priorities straight is the Impact/Effort Matrix. I’ve used this with countless teams to quickly cut through the noise. All you do is plot each potential fix on a four-quadrant grid by asking two simple questions:
Impact: Realistically, how much will this change improve our conversion rate? (High or Low)
Effort: How much time, money, and developer muscle will this take to implement? (High or Low)
Just by plotting your ideas, you instantly get a clear visual of where to focus your energy.
Using the Impact vs Effort Prioritization Matrix
This simple framework helps you decide which CRO tasks to tackle first based on their potential impact and the resources they’ll consume.
Quadrant | Description | Example Task |
|---|---|---|
Quick Wins | High Impact, Low Effort. These are your goldmine. Jump on them immediately for a fast boost in results and morale. | Changing a vague CTA button from "Submit" to "Get My Free Quote." |
Major Projects | High Impact, High Effort. These are the big, strategic moves. You need to plan for them carefully, as they require significant resources. | A complete redesign of your multi-step checkout funnel. |
Fill-Ins | Low Impact, Low Effort. Tackle these when you have a bit of downtime, but don't let them distract you from the bigger fish. | Fixing a minor typo on a blog post that gets very little traffic. |
Time Sinks | Low Impact, High Effort. Avoid these like the plague. The return simply isn't worth the investment. | Building a custom, complex animation for an internal "About Us" page. |
Your first move should always be to raid the "Quick Wins" quadrant. Nailing these early on builds momentum, proves the value of your CRO program, and gets everyone excited for what's next.
Diving Deeper with the RICE Model
Sometimes, you need a more granular, data-driven way to compare different kinds of projects. That’s where the RICE scoring model shines. It’s fantastic for getting everyone on the same page because it replaces subjective arguments with a clear, calculated score.
RICE is an acronym for:
Reach: How many people will this change actually affect in a given period? (e.g., 5,000 visitors see the pricing page each month)
Impact: How much will this move the needle on our goal? (Use a simple scale: 3 for massive, 2 for high, 1 for medium, 0.5 for low)
Confidence: How certain are you about your Reach and Impact numbers? (Use a percentage: 100% for "I have solid data," 80% for "I have a good estimate," 50% for "this is a bit of a long shot")
Effort: How much time will this take from your team? (Estimate in "person-months"; a small task might be 0.5 person-months)
The formula is straightforward: (Reach × Impact × Confidence) / Effort.
Pro Tip: The RICE model is my go-to when I need to compare apples to oranges. It helps you decide between, say, a homepage messaging tweak and a UX fix in the sign-up flow by creating a common currency for value.
Let's run a quick scenario. Imagine you're working on a SaaS pricing page. You could test a new headline (low effort, high reach) or build out a complex pricing calculator (high effort, high impact). By plugging both ideas into the RICE formula, you can objectively see which one delivers more value for the resources required. It takes the guesswork out of the equation and aligns your whole team around a clear winner.
Actionable UX and Messaging Changes That Work

Alright, you’ve done the diagnostic work and pinpointed the biggest roadblocks on your site. Now for the fun part: turning those insights into real fixes. This is where your data analysis meets design and a little bit of human psychology.
You don't need a massive site overhaul to see a dramatic lift in conversions. Often, small, strategic tweaks to the user experience (UX) and your messaging are all it takes. Let's dig into the battle-tested changes that address the most common reasons people bounce.
Sharpen Your Messaging with Value-Driven Copy
Think of your website's copy as your best salesperson, working 24/7. If it's vague, packed with jargon, or just lists features, it's failing you. Every headline, button, and sentence needs to answer the visitor’s silent question: "What's in it for me?"
Start with your core value proposition. It has to be dead simple and hit home immediately. A visitor should grasp the problem you solve within seconds of landing on your page. No exceptions.
Next, conduct a ruthless audit of your calls-to-action (CTAs). Words like "Submit" or "Learn More" are absolute conversion killers. They’re lazy, create zero urgency, and don't tell the user what happens next. You need to transform them into benefit-driven commands.
Instead of: Submit
Try: Get Your Free Demo
Instead of: Download
Try: Download My Free Ebook
See the difference? This simple switch frames the action around what the user gets, not what they have to give. This mindset should apply everywhere. Stop listing what your product does and start explaining how it makes your customer's life better. If you want to go deeper on this, our guide on landing page design best practices is a great resource.
Build Instant Trust with Social Proof
Let's be honest—people are skeptical online. You can shout from the rooftops about how great your product is, but they'll always trust what other customers say more. This is the magic of social proof, and it’s one of the most powerful conversion levers you can pull.
The key is to place this proof right next to key decision points, like your pricing table or a "Buy Now" button.
Customer Testimonials: Get real quotes with names and photos. Even better? Video testimonials.
Ratings and Reviews: An average star rating from a trusted site can vaporize a visitor's anxiety.
Case Studies: Show off the tangible, data-backed results you've delivered for others.
Trust Badges: Logos of clients you've worked with or security seals create an immediate sense of credibility.
Don't just collect testimonials—curate them. A great testimonial doesn't just say "they're great." It overcomes a specific objection or highlights a key benefit, speaking directly to the concerns of a potential customer.
Simplify UX to Reduce Cognitive Load
Every extra click, confusing label, or unnecessary form field adds to a user's cognitive load—the mental horsepower they have to use. When that load gets too high, people get frustrated and leave. Your job is to make the path to conversion feel effortless.
Your forms are the most obvious place to start. Do you really need their phone number right now? Can you combine "First Name" and "Last Name" into a single "Full Name" field? Every single field you eliminate can directly boost your form completion rates.
Then, take a hard look at your navigation. Can a first-time visitor find what they need without thinking? If your menu is a cluttered mess, you're forcing them to work too hard. Simplify it down to the absolute essentials.
For a more proactive approach, a lead generation chatbot can be a game-changer. It engages visitors 24/7, answering common questions instantly and guiding them down the funnel before they can get stuck or confused.
Optimize for Every Device
This shouldn't even be a question anymore, but here we are: responsive design is table stakes. Your user experience must be seamless whether someone is on a desktop, tablet, or their phone.
Global eCommerce conversion rates average around 2.95%, but the device breakdown is telling. Tablets convert at 3.11%, desktops at 3.09%, and mobile still lags behind at 2.87%. That gap shows that simply shrinking your desktop site isn't a real mobile strategy.
You have to design for thumbs, not a mouse. Buttons need to be big and tappable, forms have to be a breeze to fill out on a tiny screen, and your page speed on a cellular connection better be fast. A clunky mobile experience is one of the fastest ways to alienate a massive chunk of your audience.
Validating Your Changes with A/B Testing
You’ve diagnosed the problems, brainstormed some great fixes, and even prioritized them. It’s incredibly tempting to just ship your best idea and see what happens. But hope is not a strategy. To get real, sustainable conversion lifts, you have to stop guessing and start proving what actually works.
This is where A/B testing, or split testing, becomes your secret weapon. It’s a simple but powerful method: pit your new idea (the "variant") against the current version (the "control"). By showing each version to a different slice of your audience, you get cold, hard data on what truly moves the needle. This is how you turn random shots in the dark into a reliable engine for growth.
First, Craft a Testable Hypothesis
Every great A/B test starts with a solid hypothesis. This isn't just a vague thought like, "Let's change the button color." A strong hypothesis is a clear, predictive statement that spells out what you're changing, for whom, and what you expect the outcome to be.
The best hypotheses follow a simple formula: "If we [make this specific change], then [this key metric] will [increase/decrease] because [this is the user-focused reason why]."
Let's make this real.
Hypothesis: "If we change our homepage CTA button text from the generic 'Learn More' to the action-oriented 'Get Your Free Demo,' then demo request submissions will increase by 10% because the new copy offers a much clearer and more compelling value exchange."
See the difference? This statement is specific, measurable, and directly tied to a business goal. It sets the stage for a clean experiment where everyone knows what you're testing and what success looks like.
Setting Up and Running the Test
With your hypothesis ready, it's time to build the experiment. Tools like Google Optimize, Optimizely, or VWO make this surprisingly straightforward, even if you’re not a developer. You'll create your variant page and then use the tool to automatically split your website traffic between the control and the variant.
The dashboard in a tool like Google Optimize becomes your command center for these experiments.
From here, you can launch A/B tests, personalization campaigns, and other "experiences," all while tracking their impact on your most important goals.
When you're configuring the test, you absolutely have to define two things upfront:
Your Primary Goal: What is the one metric that decides the winner? If your hypothesis is about getting more demo requests, then form submissions is your goal. Stick to it.
Statistical Significance: This is your confidence level, and the industry standard is 95%. Hitting this number means you can be confident the results aren't just a random fluke.
Common A/B Testing Traps to Avoid
Running a test is easy. Running a good test that gives you trustworthy results? That takes a bit of discipline. I’ve seen teams make the same simple mistakes over and over, completely invalidating their hard work.
Here are the biggest pitfalls and how to sidestep them:
Calling the test too early. This is the cardinal sin of A/B testing. You see one version get a quick lead after two days and get excited. Don't fall for it. User behavior changes dramatically between weekdays and weekends. Let your test run for at least one, preferably two, full business cycles (so, two weeks) to smooth out those fluctuations.
Testing too many things at once. If your variant has a new headline, a different button color, and a new hero image, you have no idea which change actually caused the result. Was it one of them? All of them? You'll never know. Isolate one key variable per test to get clean, actionable insights.
Ignoring statistical significance. If your tool says a result is only 80% significant, it’s not a winner. It’s a coin toss. A 20% chance of being wrong is way too high to bet your business on. Wait for that 95% confidence threshold before you make a decision.
Getting started can feel different depending on your tech stack. For example, you can find guides on how to run a simple A/B test for Framer that show these principles in a specific context. By making this methodical approach part of your DNA, you build a culture where every change is a chance to learn, improve, and grow.
Your Conversion Optimization Action Plan
Alright, let's put everything we've discussed into a practical roadmap. The key to successful CRO is striking a balance between quick fixes that build momentum and bigger projects that drive sustainable growth. This approach helps you get some immediate results while you work on the foundational stuff.
Quick Wins to Implement Now
You can get started on these right away. They're low-effort changes that often have a surprisingly high impact, giving you and your team a tangible boost this week.
Clarify Your CTA Copy: Ditch vague buttons like "Submit." Instead, use action-oriented and benefit-driven commands like "Get Your Free Quote" or "Download My Guide."
Add Social Proof: Find your most powerful customer testimonial—one with a photo, if possible—and place it directly below your main call-to-action. It works wonders for building trust right at the decision point.
Reduce Form Friction: Take a hard look at your main lead or checkout form. Can you remove at least one non-essential field? Every field you cut makes it that much easier for a user to convert.
Strategic Initiatives for Long-Term Growth
These are the bigger swings that require more planning but lead to significant, lasting improvements. As you map these out, it's smart to explore a playbook of AI-Powered Conversion Optimisation Best Practices to see where the industry is heading.
The core of any long-term strategy is a disciplined testing process. It's not about guessing; it's about validating. The basic flow always comes back to forming a solid hypothesis, running a clean test, and then digging into the results.
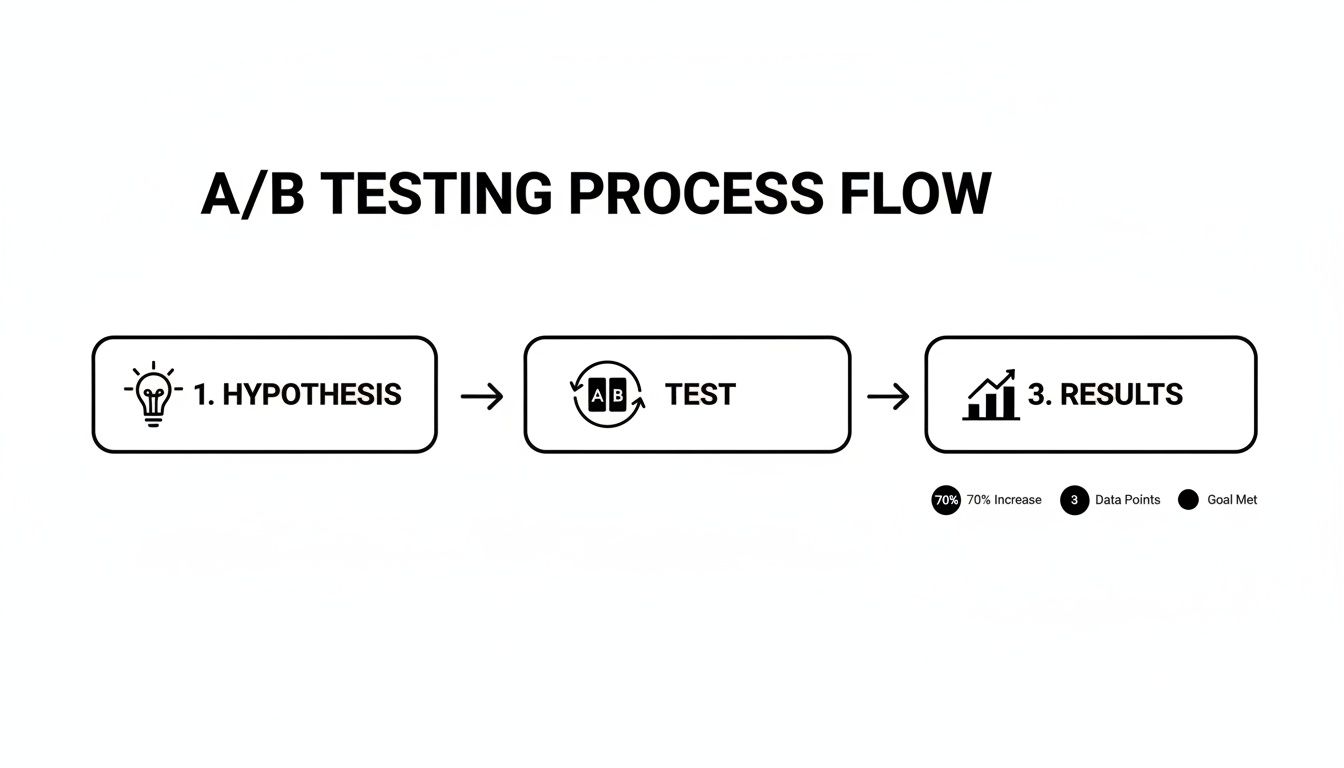
Sticking to a structured approach like this ensures that every change you roll out is backed by real user data, not just a gut feeling. That's how you build a website that truly converts.
Frequently Asked Questions
When you dive into conversion optimization, a few questions always seem to pop up. Let's cut through the noise and get straight to the answers so you can focus on what really moves the needle.
What Is Considered a Good Website Conversion Rate?
Everyone wants to know the magic number, but the honest answer is: it depends. A "good" conversion rate is a moving target that changes based on your industry, what you're selling, and where your visitors are coming from.
You'll often hear 2-3% thrown around as a general benchmark, and sure, top-tier sites might hit 5% or more. But comparing a B2B SaaS free trial signup to an eCommerce sock purchase is like comparing apples and oranges.
The best approach? Forget the universal average. Focus on your baseline. The real win is in consistently bumping up your own numbers, month after month, by truly understanding what your audience wants and testing your way to a better experience.
How Long Should I Run an A/B Test?
This is a big one. It's tempting to call a test the second you see one version inching ahead, but that's a classic mistake. You need to let an experiment run long enough to hit statistical significance—usually a 95% confidence level. This proves your result isn't just a fluke.
For most sites, a good rule of thumb is to run a test for at least two full weeks. Why? Because user behavior changes. People browse differently on a Tuesday morning than they do on a Saturday night. Running it for a couple of business cycles smooths out those peaks and valleys, giving you data you can actually trust.
Stopping a test too early is a recipe for a false positive. You might implement a "winner" that does absolutely nothing for your bottom line in the long run. In A/B testing, patience pays off.
Where Is the Best Place to Start Optimizing?
Don't try to boil the ocean. Start where you can make the biggest dent with the least amount of work: your high-traffic pages that just aren't pulling their weight. These are your goldmines for quick wins.
For most businesses, this usually means zeroing in on the homepage, a critical product page, or the pricing page.
Dig into your analytics and find the pages with tons of visitors but alarmingly high bounce or exit rates. Those are the leaks in your funnel. Once you've found them, use tools like heatmaps or session recordings to see why people are leaving. Understand the "why" before you even think about brainstorming a fix.
At Shalev Agency, we turn these insights into action. We partner with teams like yours to design and build high-quality websites and products that convert. Get in touch to ship faster and drive measurable outcomes.